


The USDA Hardiness Zone Map is an essential tool for gardeners looking to optimize their plant care. In 2023, the U.S. Department of Agriculture released an updated version and it’s packed with new features and vital information. We’ll explore the significance of this map, what’s new, and what it means for your plant care routine.
What is the Plant Hardiness Zone Map?
The Plant Hardiness Zone Map is a tool that helps determine which plants will thrive in your area. It primarily benefits approximately 80 million American gardeners and growers, including those in the St. Louis area. Understanding USDA Hardiness Zones for home gardening can help you make informed decisions about plant selection.
Beyond the gardening community, the map also influences other areas. The USDA Risk Management Agency uses it to set crop insurance standards. Additionally, scientists utilize it to study the spread of exotic weeds and insects.
Key Updates to the 2024 Plant Hardiness Zone Map
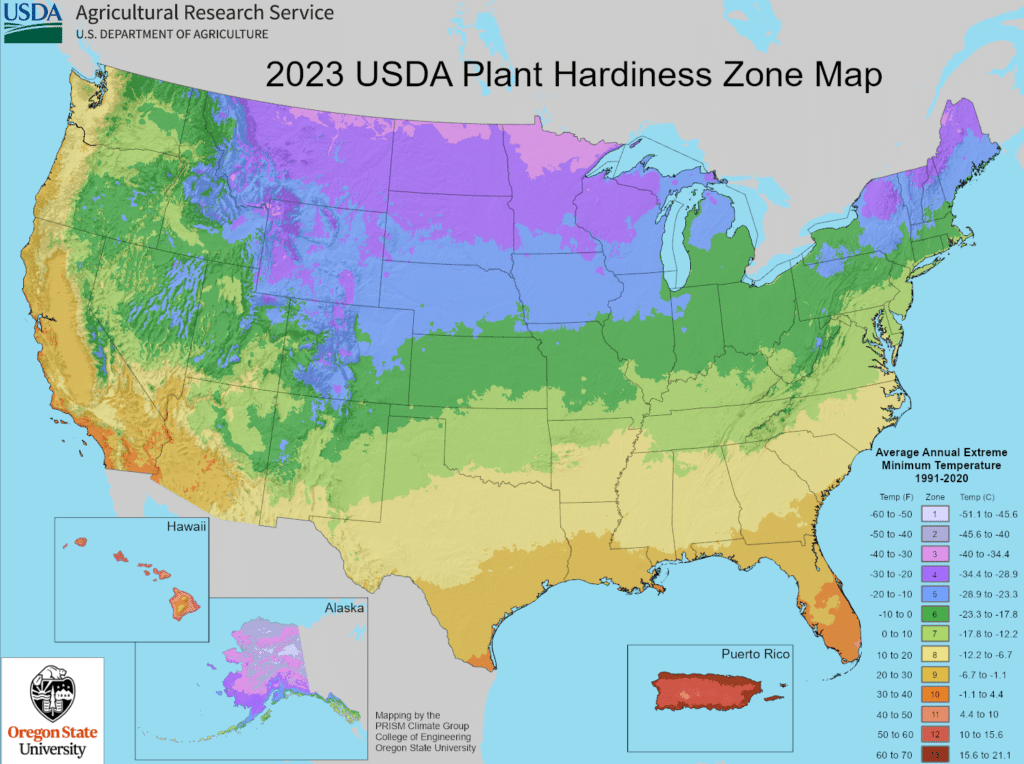
The 2024 map features enhanced accuracy and detail, using data from 13,412 weather stations—nearly twice as many as in 2012. It determines zones based on 30-year averages of the coldest winter temperatures, divided into 10-degree Fahrenheit zones and 5-degree Fahrenheit half-zones.
The increased number of weather stations allows for more accurate weather reporting, enabling the USDA to refine the hardiness zones. This additional data showed that about half of the country has shifted to the next warmer half-zone.
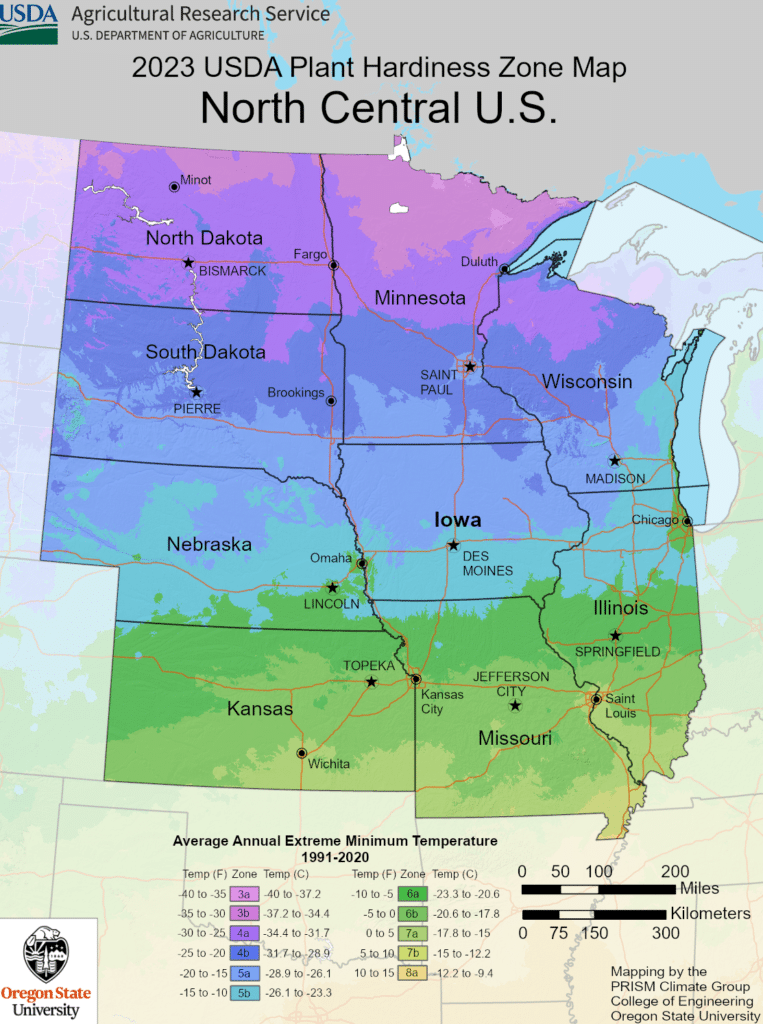
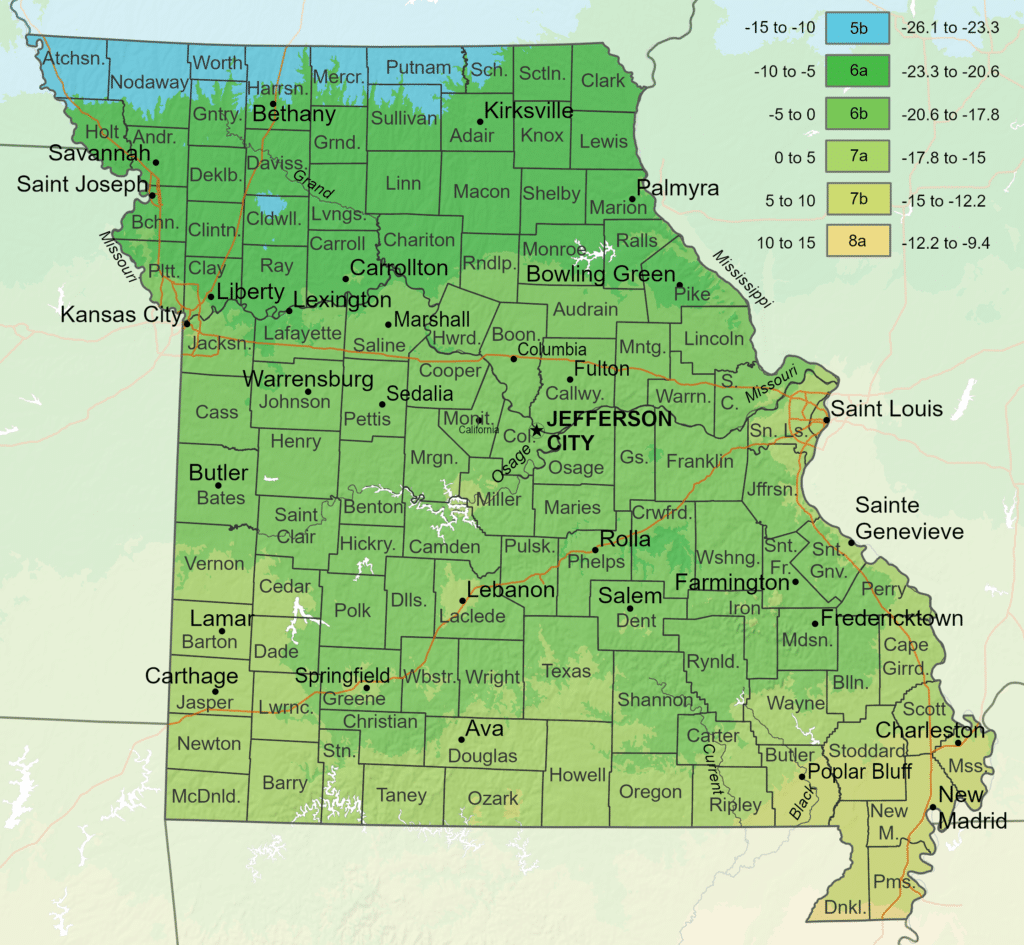
At our location in Chesterfield, Missouri, we moved from a Zone 6a to a Zone 6b hardiness zone due to a temperature increase of 6 degrees. Areas closer to St. Louis, particularly within the inner belt, have even experienced an increase to Zone 7a.
Adapting Your Garden to the New Zones
It’s exciting to think that our plant options might expand here in St. Louis. However, this change doesn’t mean you should start planting the plants you’ve long admired south of St. Louis.
It’s important to remember that the average annual temperature defines the hardiness map zones. This means there is a higher winter temperature and a lower one. The lower temperature may not occur often, but when it does, it can cause significant damage to those borderline plants.
The updated USDA Plant Hardiness Zone Map serves as an invaluable resource for gardeners, offering crucial insights into optimal plant selection and care strategies. This sophisticated tool provides a wealth of information about regional climate patterns and their impact on plant survival and growth. By delving into the intricacies and nuances of this map, gardeners can gain a deeper understanding of their local growing conditions and explore the unique characteristics of each microclimate. This knowledge allows gardeners to choose plants that are well-suited to their region’s climate. By leveraging this comprehensive tool effectively, we can significantly enhance our ability to create thriving, resilient gardens that are better adapted to local environmental conditions.